

Customer churn rate marketing is the practice of treating lost customers as a marketing problem, not just a finance number. Most teams watch new sales every day and check churn once a quarter, if at all. That habit is expensive, because churn is the number that decides whether growth sticks.
This guide explains what the customer churn rate measures, why it stays quiet, how a small monthly figure turns into a large yearly loss, and what to do about it. The worked example uses illustrative numbers, so swap in your own.
What Customer Churn Rate Actually Measures
Customer churn rate is the share of customers who leave in a period. If you start the month with 1,000 customers and 50 cancel, your monthly churn rate is 5%.
The formula is simple: customers lost during the period, divided by customers at the start of the period. Revenue churn works the same way, using recurring revenue instead of headcount.
Two details trip people up. First, count only the customers you had at the start of the period, not the ones you added during it. Second, keep monthly and annual figures separate, because they are not interchangeable.
Why the Quiet Metric Hides in Plain Sight
A new sale arrives with a notification, a celebration and a line in the pipeline report. A cancellation arrives as a number that is a little smaller at the end of the month. Nobody rings a bell.
That asymmetry shapes behavior. Acquisition has owners, budgets and dashboards. Churn often has none of those, so the leak continues while the team works on the tap.
Growth looks healthy as long as new customers outrun the leak. The moment acquisition slows, the leak shows up all at once.
A Worked Example: What 5% Monthly Churn Really Costs
Here is an illustrative case. A subscription business has 1,000 customers paying $100 a month, which is $100,000 in monthly revenue. Monthly churn is 5%.
- Each month, about 50 customers leave.
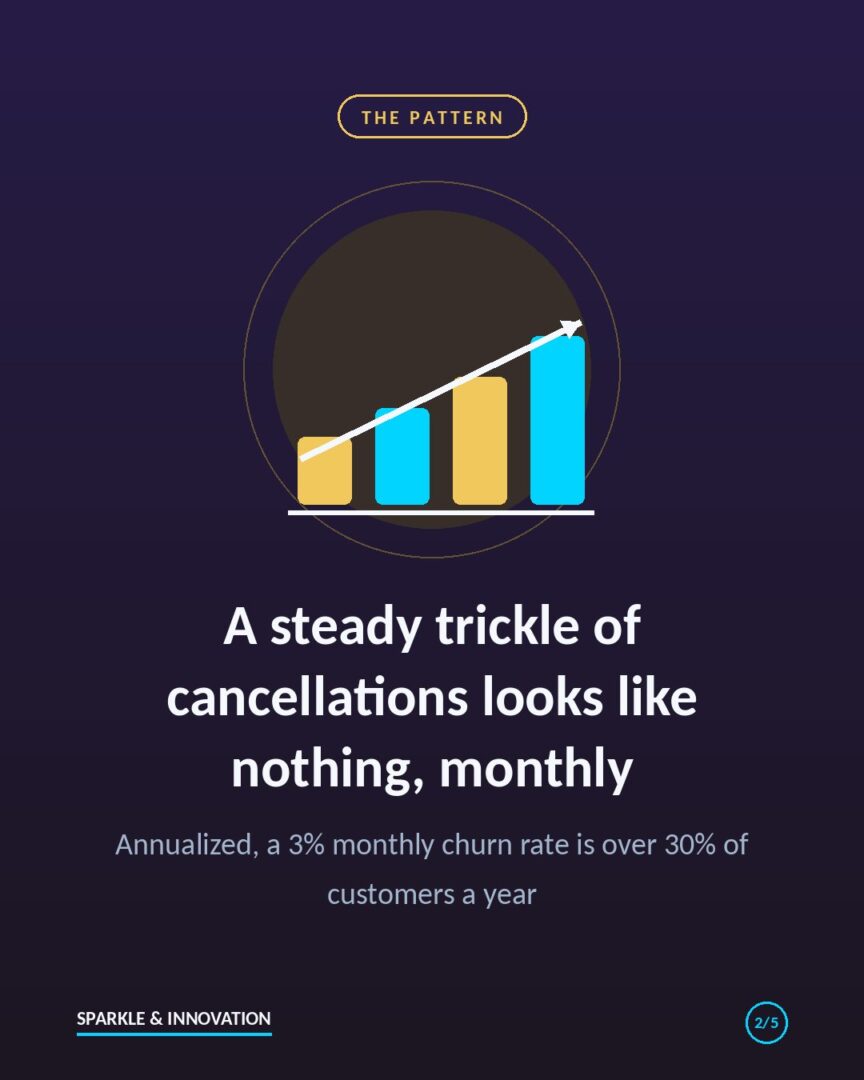
- If you add no new customers, you keep 0.95 to the power of 12 of your base after a year. That is about 54%, so roughly 46% of customers are gone.
- To stay flat, you must win about 50 new customers every month.
- At an assumed acquisition cost of $300 per customer, standing still costs about $15,000 a month.
Now suppose a retention effort lowers churn from 5% to 4%. You lose 40 customers a month instead of 50, so you need 40 replacements. That saves about 10 acquisitions, or roughly $3,000 a month, before counting the extra revenue from customers who stay longer.
A common shortcut estimates average customer lifetime as one divided by monthly churn. At 5% that is 20 months. At 4% it is 25 months. One point of churn buys five more months of revenue from every customer you win.
Why Retention Spend Compounds While Acquisition Spend Resets
Money spent on acquisition buys one customer once. If that customer leaves, the spend is gone and you buy another.
Money spent on retention keeps working. A customer who stays another year keeps paying, keeps referring and keeps lowering your blended cost per customer. Reichheld and Sasser made this case in Zero Defections, Harvard Business Review (1990), reporting that small improvements in retention lifted profits by 25% or more in the industries they studied.
For a deeper comparison of the two budgets, see our guide to customer retention vs acquisition cost.
The Psychology Behind Why Customers Leave
People rarely cancel in a single dramatic moment. They drift. Usage drops, a support ticket sits too long, a price change feels unfair, and the cancel button starts to look reasonable.
Behavioral science gives you three practical lenses:
- Peak-end rule. People judge an experience by its most intense moment and its ending (Kahneman et al., 1993). The last interaction before a customer decides matters more than the average one.
- Fairness. Customers react strongly to prices that feel unfair. Our post on raising prices without losing customers covers how to give notice and show value first.
- Goal gradient. People speed up as a goal gets closer (Kivetz, Urminsky and Zheng, 2006). Visible progress, such as setup steps completed, gives customers a reason to continue.
Five Ways to Lower Customer Churn Rate This Quarter
- Find the first-session win. Customers who reach value early are more likely to stay. Define that first win and measure how many people reach it.
- Segment your churn. Split by plan, channel, customer size and signup month. The average hides the pattern.
- Talk to the people who left. Ask five recent cancellations why. One short call often beats a survey of hundreds.
- Watch the warning signs. Falling logins, unanswered emails and slow support replies usually come before cancellation.
- Fix the ending. Make the cancellation and offboarding experience respectful and clear. It is the last thing customers remember, and some will return.
Put Churn on the Same Dashboard as New Bookings
The simplest fix is also the most effective: show churn next to new sales so the net change is impossible to miss. Use this checklist:
- Report new customers, lost customers and net change in one view.
- Track monthly churn and the annualized equivalent side by side.
- Name one owner for churn, with a quarterly target.
- Review the segments with the highest churn every month.
- Calculate how many new customers you need just to replace the ones you lose.
If your team also struggles with speed after a new lead arrives, our guide to sales follow-up strategy pairs well with this one.
How to Calculate Customer Churn Rate Step by Step
You can calculate your customer churn rate in about ten minutes with a spreadsheet. Follow these steps:
- Pick a period. Use one calendar month so results are easy to compare.
- Count customers at the start. Use active paying customers on day one of the month.
- Count customers who left. Include cancellations and non-renewals from that starting group.
- Divide. Lost customers divided by starting customers gives your monthly churn rate.
- Annualize it. Take one minus the monthly churn rate, raise it to the 12th power, and subtract the result from one. At 5% monthly churn that gives about 46%. At 4% it gives about 39%.
- Repeat for revenue. Revenue churn can differ from customer churn if your largest or smallest customers leave first.
Do not annualize by multiplying the monthly rate by twelve. That overstates the loss, because each month starts with fewer customers than the last.
Common Customer Churn Rate Mistakes to Avoid
- Blending new and old customers. Customers who joined and left in the same month distort the starting-count formula. Track them separately.
- Looking only at the average. A healthy blended rate can hide one plan or channel that loses customers fast.
- Treating all churn as bad. Some customers were never a good fit. Rising churn from poor-fit customers is a targeting problem, not a service problem.
- Ignoring involuntary churn. Failed card payments and expired details end subscriptions without the customer deciding anything. Fixing billing recovery is often the quickest win.
- Waiting for the quarterly report. By the time the quarter closes, three months of customers have already left.
Customer Churn Rate Marketing FAQ
What is a good customer churn rate?
It depends on your model. Consumer subscriptions usually see higher monthly churn than business contracts with annual terms. Instead of chasing an industry average, compare your own rate month over month and by segment, and aim to move it down steadily.
Is churn a marketing problem or a customer success problem?
Both. Marketing sets expectations before the sale, and customer success delivers on them after. If the promise and the product do not match, churn follows. That is why marketing teams should own part of the churn target.
How often should I review churn?
Review it monthly at minimum, with a quick weekly check on early warning signs such as falling usage and unanswered emails.
How do I find out why customers leave?
Ask them. A short exit conversation with five recent cancellations will usually show a pattern faster than a long survey. Pair what they say with what the data shows about their last 30 days of activity.
The Takeaway
New sales fill the bucket. Churn drains it. Until both appear on the same screen, growth numbers will look better than the business really is.
This week, calculate your monthly churn rate, convert it to an annual figure, and work out what it costs to replace the customers you lose. Then pick one of the five actions above and assign an owner.
Which number is bigger in your business today: customers won, or customers lost?